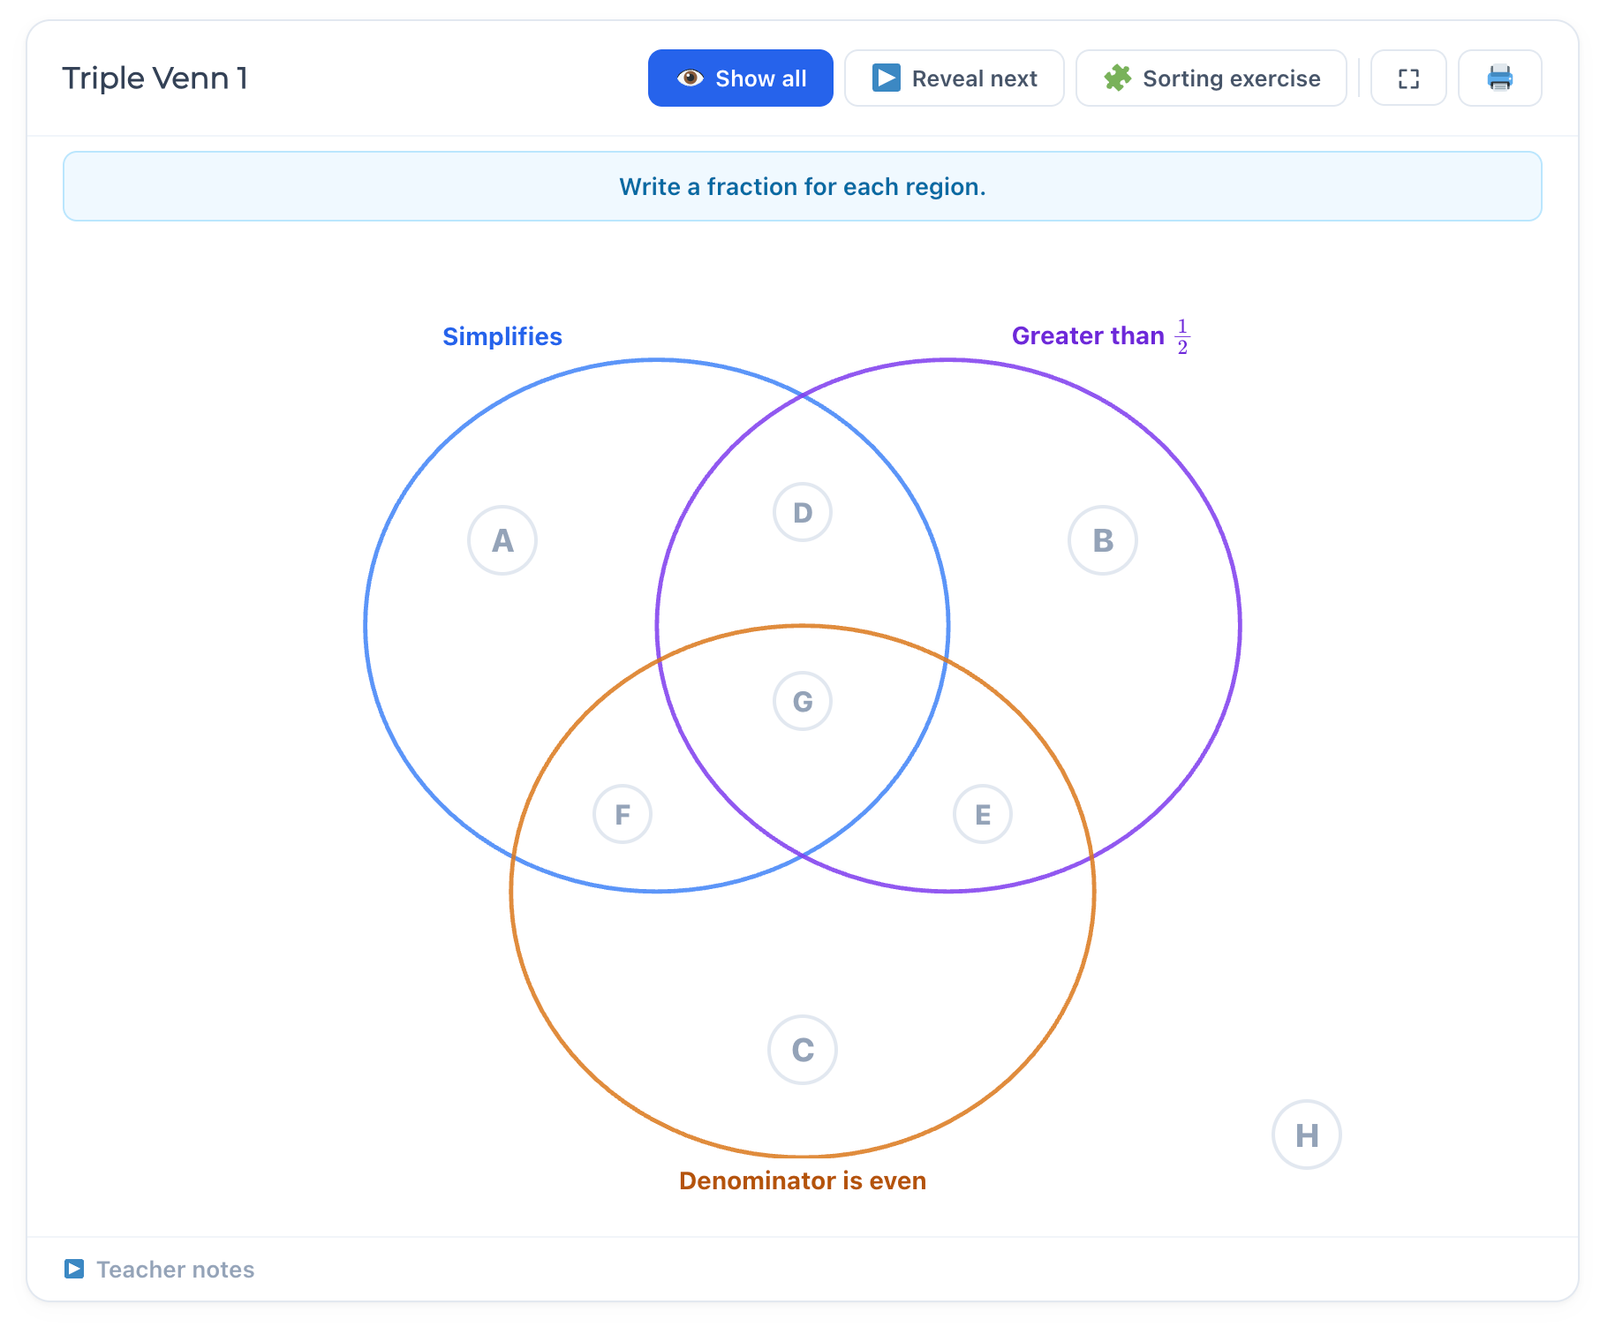
Venn Diagrams
Practise core maths skills whilst developing mathematical reasoning, communication, and the ability to construct arguments.

How Venn Diagrams Work
🎯 Find examples — place examples into each region of the Venn Diagram
🚫 Spot impossibles — decide if any region is impossible, and explain why
🔀 Sort first — use the built-in sorting exercise if you need a way in
🔁 Go further — find multiple examples, boundary cases, and extremes
✏️ Create your own — design a new Venn Diagram with exactly one impossible region
How to Use Venn Diagrams
👩🏫
Teachers
Use Venn Diagrams to practise core skills whilst developing reasoning and communication. If students find it too challenging, start with the sorting exercise. Use the extension questions below to stretch and challenge.
Tip: I have written a post containing lots of tips to help make Venn Diagrams more effective here.
📚
Students
Begin by sorting the examples into the correct region. Then try to come up with some examples of your own. Can you find an example for every region?
Tip: If a region seems impossible, don’t just skip it — try to explain why no example can exist.
👨👩👧
Parents
Work through the regions together. Check each other’s examples, and see how many you can come up with for each region. The conversation and reasoning matter as much as the answers.
Tip: Ask “Can you think of a really big or really small example for that region?” to push thinking further.
Extension Questions
If students finish the main Venn Diagram task, try these challenges:
Jump to Topic
Number
Positive integer basics
Positive integer arithmetic
Factors, multiples and primes
Negative numbers
Rounding and estimating
Decimals
Fractions
Percentages
Surds and indices
Algebra
Brackets
Inequalities
Coordinates and graphs
Sequences
Geometry
Shape properties
Perimeter, area and volume
Statistics
I’m adding new topics regularly — keep checking back for more! 🚀